We all know the feeling when we hear the word “reporting”: It feels, at least, unsatisfactory. But in Jira, reporting is not just a tedious task; it is the most crucial way to ensure you and your team are on track. More than a simple set of charts, Jira reports provide an essential level of transparency into your work. They act as a real-time compass, providing the direction needed to navigate the complexities of modern project management.
Why is that? It is because Jira reports are a comprehensive set of tools. They are specifically designed to visualize trends and provide crucial insights into a project’s health and a team’s performance. Moreover, these tools provide access to a wide range of metrics (which we will dive into soon) that allow for a deeper, data-driven understanding of your team’s workflow.
What are the Benefits of Effective Reporting?
Okay, Jira Reports are great. We all get it. But why do we need great reports? Or, let’s sharpen the question a bit: What benefits do we get with comprehensive reporting? Well, Jira reports are powerful catalysts for organizational health and performance. A well-designed reporting system enables teams to understand their own velocity, which in turn allows them to make more accurate predictions for future performance and delivery dates. This real-time visibility is invaluable, as it gives teams immediate access to their key performance indicators (KPIs) and allows for swift, data-driven decisions. For example, if a report highlights an unexpected spike in incident reports, a team can immediately investigate and correct the issue before it escalates.
Scopes and Perspectives: Levels of Reporting
The level of reporting in Jira determines the kind of questions being asked and the audience for the answers.
Individual Reporting
This type of reporting provides an overview of a user’s work assignments, helping them identify potential overdue issues. It also helps them analyze issue resolution rates and times, and monitor their progress on a given project.
Questions it will answer:
- What are the jobs on me? Which ones are finished? How much time is left until the due date of which job?
- What are the upcoming jobs?
Team Reporting
This is a distinct type of reporting that helps a user stay informed about the workload and performance of their team. It helps in the management of daily and weekly progress, providing insights into team workload, sprint burndown, and task prioritization, ensuring the team meets its goals.
Project Management Reporting
This type of reporting is used to monitor a project’s health, progress, and scope. It helps a project manager to assess whether the project is on track to meet its final delivery date.
Service Management Reporting
This type of reporting provides insight into the status of incident, problem, and change management, serving as a basis for decision-making in overall service health.
Essential Business Questions Jira Reporting Will Answer
To run things more smoothly, we need to ask the correct questions. And reporting helps us to answer them properly. Here are some questions it will answer:
- What are the tasks/projects in my team/department? At what stage of completion is each one? When will each one be finished?
- Are there any delayed tasks? If so, why are they delayed?
- Are there any tasks exceeding their estimated time/date/cost? If so, which ones and why?
- Is there a problem that needs to be solved or a task that needs to be unblocked right now?
- Which tasks were extended/delayed/caused problems in the past? What was the reason? How can we overcome it? What precautions can we take to prevent it from happening again?
For Upper Management:
- What tasks/projects/programs are there? What is the status of each? When do they end?
- Are there any tasks exceeding the time or effort plan? Are there any tasks that will not be completed on schedule?
What Are Dashboards and Gadgets in Jira?
At the heart of Jira’s reporting ecosystem are dashboards and gadgets. Think of your dashboard as your personal mission control—a single, customizable screen that gives you a complete overview of what’s happening across all your projects. Gadgets are the individual screens and dials that make up the control panel, and they are the engines of your reporting system. You can create separate dashboards for different needs. The requirements of you and your team determine what information to include.
The Architecture of Dashboards
Jira dashboards are built entirely from these gadgets, which are modular reports designed to display real-time data. Each gadget works by taking a specific group of Jira issues—usually defined by a saved filter—and generating a report from that exact dataset. This system is incredibly flexible:
Native vs. App Gadgets: You can use gadgets that are pre-installed in Jira or choose specialized gadgets that come from apps on the Atlassian Marketplace.
Plug-and-Play: A major advantage is that you can add the same gadget multiple times to one dashboard, connecting each copy to a different filter or project to run parallel reports at a glance.
Centralizing Reports: Many of the powerful analytical reports you find on a single Jira project board (like a Burndown Chart or Control Chart) can also be added directly to your dashboard as a gadget, creating one strategic command center.
Built-in Jira Gadgets
To get started, Jira comes pre-loaded with a comprehensive set of built-in gadgets, categorized by their function:
Activity Stream Gadget
Shows a summary of recent activity across your projects.
Assigned To Me Gadget
Displays all open issues currently assigned to you across all projects.
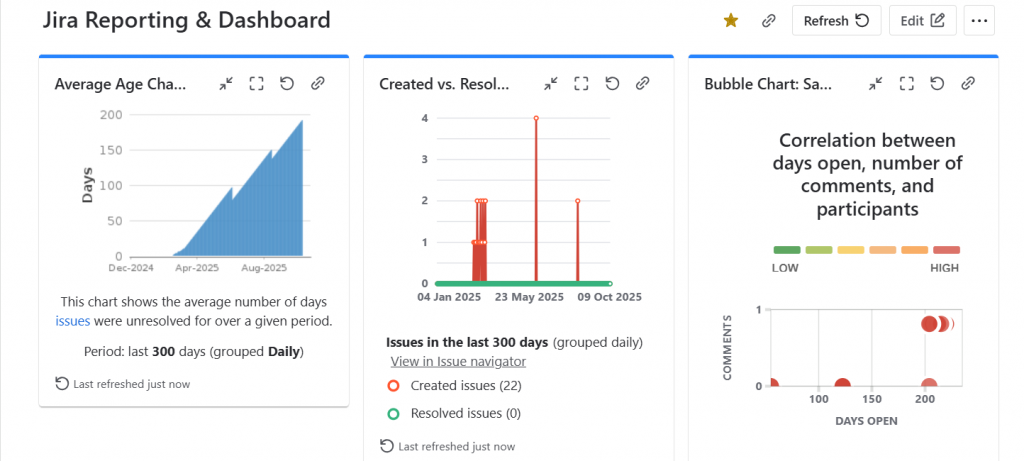
Average Age Gadget
Shows a bar chart of the average number of days that issues have been unresolved.
Average Time in Status Gadget
Displays the average number of days issues have spent in a particular status.
Bubble Chart Gadget
A visual tool that identifies popular and significant work items by displaying data in four dimensions.
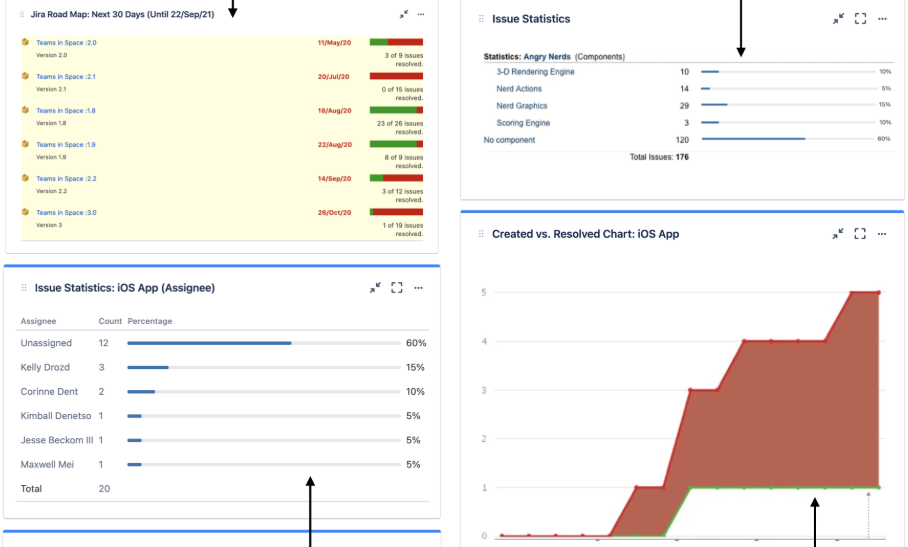
Created vs Resolved Gadget
Displays a difference chart comparing issues created versus those resolved over a specific period.
Filter Results Gadget
Shows a customizable list of issues based on a specified JQL filter.
Introduction Gadget
Displays a configurable welcome or context message on the dashboard.
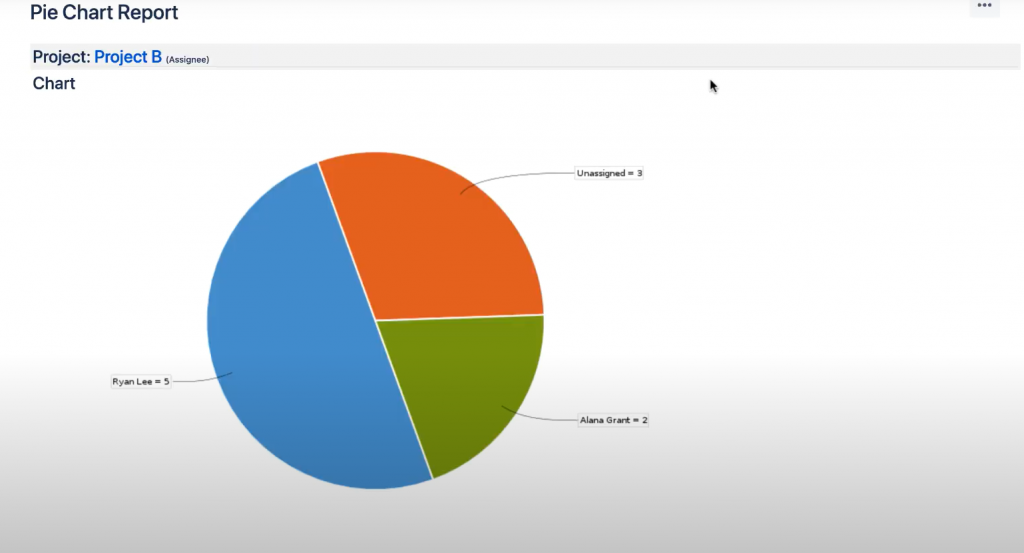
Pie Chart Gadget
Displays issues from a project or filter grouped by a statistic type (e.g., Status, Priority, Assignee).
Resolution Time Gadget
Shows a bar chart of the average time it takes to resolve issues in days.
Road Map Gadget
Shows versions due for release within a specified period and progress toward completion.
Days Remaining in Sprint Gadget
Shows how many days are left until the current sprint ends.
Sprint Burndown Gadget
A burndown chart is used to track remaining work in an active sprint.
Time Since Issues Gadget
Tracks the time that has passed since a specific event (like ‘Created’ or ‘Resolved’) occurred for a group of issues.
Time to First Response Chart
Displays the average number of hours taken to provide the first response to work items within a selected space or filter.
Two Dimensional Filter Statistics Gadget
Displays statistical data from a filter in a table format, based on two issue fields.
Wallboard Spacer Gadget
Used to add space between other gadgets on a dashboard.
Watched Work items Gadget
Displays the list of work items you are currently watching.
Beyond Jira’s built-in gadgets, the Atlassian Marketplace offers many more. If you can’t get the view you need with the standard options, you can search the Marketplace for an app that fits your requirements.
Best Practices for Building Actionable Dashboards
Here are a few simple rules for building a dashboard that drives action, not confusion:
Avoid Gadget Overload
Have you read Tolstoy’s War and Peace? It has lots of long Russian names, too many characters, and it is super confusing, right? It is the same for gadgets. More gadgets make it almost impossible to follow. If you need to show more data, create a new, dedicated dashboard for that specific use case.
Focus on Visuals
A dashboard filled with text is a raw list, not a report. Its purpose is to tell a story with data, so focus on charts and graphs that communicate insights at a glance. While an issue list can be useful, try to limit yourself to one per dashboard to maintain a clean, visual balance.
Curate for Your Audience
When we decide to write a blog post, the first question we ask is, “Who is it for?” Before you build a dashboard, ask yourself the same question. Is it for your team? Focus on workload distribution and sprint progress. Is it for a manager? Show high-level metrics like average resolution times. A good dashboard tells a clear, relevant story that is tailored to its audience. You can create as many as you desire for different works and users.
Dashboard or Report? Making the Right Choice for Your Needs
Let’s keep it simple. The real difference between a Jira dashboard and a report is your point of view.
Dashboard is where you put all your little “gadgets” together on one screen for a live, at-a-glance look at multiple projects. This view is perfect for those constant “let me just check in” moments.
But when you need to go deeper, a report is what you need. A report is your deep dive. It clears the deck and takes over your whole screen, letting you get into the weeds of a single project to find the real story behind the data.
So, ıf you want to see a little bit of everything, you need a dashboard. If you need to see everything about one specific thing, you need a report.
Jira’s Built-In Reporting Capabilities
Jira’s native capabilities are the foundation of any effective reporting strategy. There are lots of important things native Jira can do. We will explore later what Jira Reports cannot do, and share a great solution too.
How to Generate Reports in Jira?
Jira makes it straightforward to generate standard reports. The process varies slightly depending on your project type:
Generating Reports in Company-Managed Projects: In these projects, you can go directly to the Reports section in the sidebar and select a report to begin generating it.
Generating Reports in Team-Managed Projects: For team-managed projects, you must first ensure that the Reports feature is enabled by navigating to Project Settings, then Features, and then Reports. After that, you can find the Reports section in the sidebar and select a report.
Jira’s Report Types and Their Use Cases
Jira’s built-in reports are meticulously designed to support specific agile methodologies and provide crucial insights into various aspects of project work. A comprehensive understanding of each report’s purpose is key to leveraging Jira to its full potential. Scrum and Kanban boards serve as living reports that visualize the current state of work, too. Even with read-only access, they can clearly communicate progress to anyone viewing them.
Kanban Agile Reports
Kanban methodology, focused on continuous flow, has its own set of powerful reports.
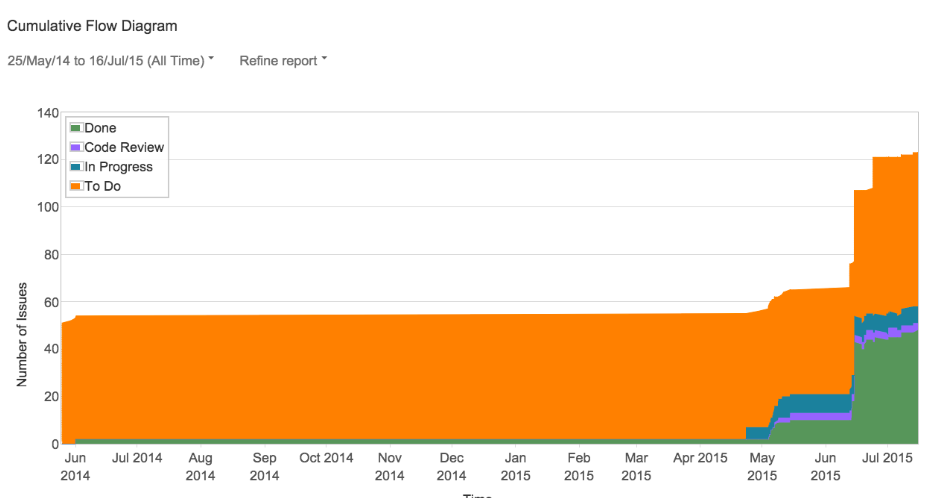
The Cumulative Flow Diagram (CFD): This report visualizes the number of issues in each workflow status over a period of time. It is an invaluable tool for identifying bottlenecks. When an area on the chart widens vertically over time, it indicates that work is accumulating in the corresponding status, revealing a point of friction in the workflow.
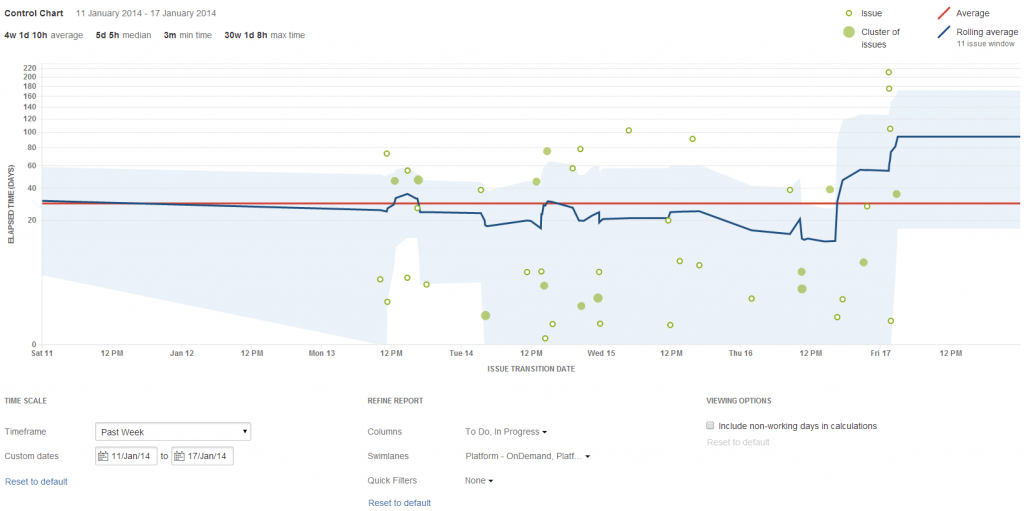
The Control Chart: This report helps a team determine and predict future performance by analyzing cycle and lead times. It provides a view of the time elapsed for completed work items, allowing a team to identify outliers that might have taken an unusually long or short time to complete.
Scrum Agile Reports
Scrum, with its time-boxed sprints, relies on a different set of reports to track progress and plan capacity.
The Sprint Report: This report helps a team understand what work was completed within a sprint, identifying issues such as over-commitment or excessive scope creep. It provides a detailed list of completed, incomplete, and removed work items.
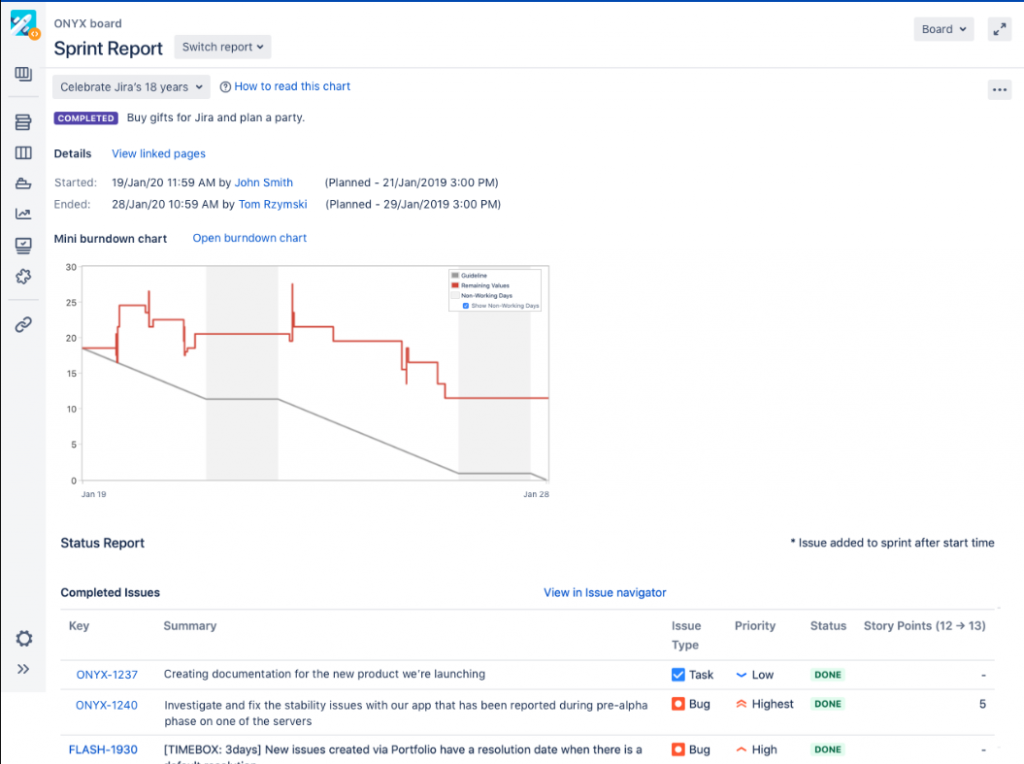
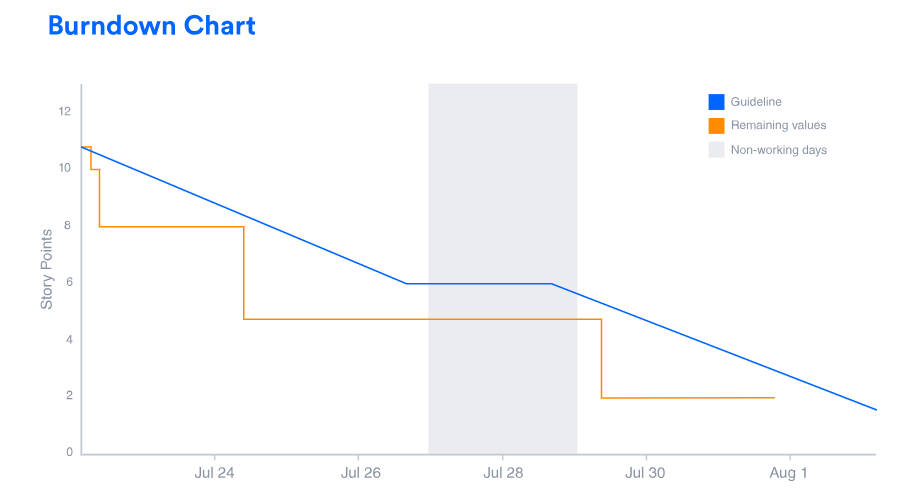
The Burndown Chart: A cornerstone of Scrum reporting, the Burndown Chart visually tracks the total remaining work in a sprint. It allows a team to monitor its progress against the sprint goal and adapt as needed.
The Burnup Chart: This report provides a visual representation of a sprint’s scope, as well as its completed and remaining work. It helps a team stay on track and can be used to predict when the sprint will be completed.
The Velocity Chart: The Velocity Chart is used to track the average amount of work a team completes per sprint. By tracking both the committed and completed work over several sprints, a team can use this report to predict how quickly they can work through their backlog and make more accurate estimates for future sprints.
Epic and Release Reports: The Epic Report shows the progress toward completing an epic and helps plan work that may extend across multiple sprints. The Epic Burndown Report is a similar tool, specifically for Scrum teams, which tracks the projected number of sprints required to complete an epic. Similarly, the Release Burndown Report tracks a team’s progress toward a version’s release date, helping to identify if work is falling behind schedule.
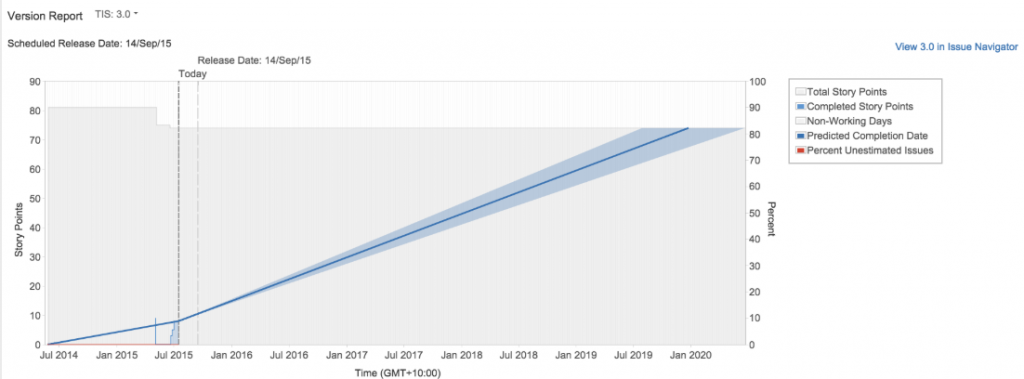
The Version Report: This report helps a team understand its progress toward completing a version and provides a predicted release date based on the team’s velocity and remaining work.
Issue Analysis Reports
Beyond agile-specific reports, Jira offers general reports for a variety of use cases, including:
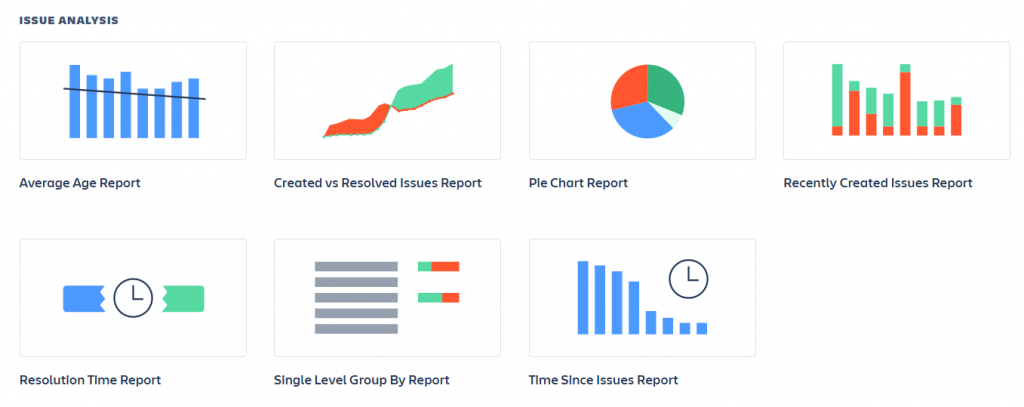
Average Age Report: Displays the average age, in days, of all unresolved issues, helping to flag tasks that may have been forgotten or are stagnating.
Created vs. Resolved Issues Report: Provides a high-level view of a team’s throughput by comparing the number of issues created to the number of issues resolved over a given period.
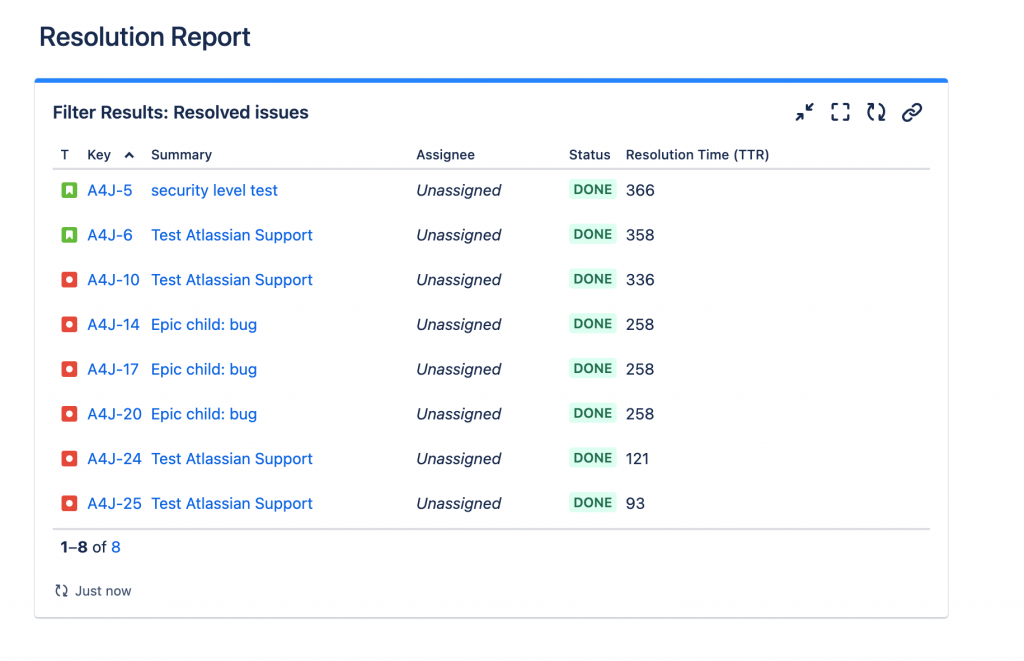
Resolution Time Report: Shows the average time it takes for issues to be resolved, providing another perspective on a team’s efficiency.
Time Since Issues Report: Shows the number of issues for which a chosen date field (e.g., ‘Created’) was set on a particular date.
Single Level Group By Report: Allows you to view search results from a filter, grouped by a field of your choice.
Pie Chart Report: Displays a pie chart of issues from a project or filter, based on a statistic of your choice.
Recently Created Work Items Report: Shows the rate at which new issues are being created.
Time Tracking Report: This report provides time tracking information on issues for a particular version of a project.
User Workload Report: Shows how much work a user has been allocated and the estimated time it should take.
Version Workload Report: Shows how much outstanding work remains (per user and per issue) before a given version is complete.
Workload Pie Chart Report: Displays the relative workload for assignees of all issues in a particular project or issue filter.
What Are The Limits of Standard Reports in Jira?
While Jira’s native reporting capabilities are a solid foundation, they are not a complete solution for every organization. As teams and their workflows develop, they often experience a lack where built-in reports are no longer sufficient.
Pros & Cons of Jira Standard Reports
The primary advantage of standard reports is their accessibility. They are built directly into the Jira platform, are free to use, and are easily accessible to project teams. For small teams or those new to agile, these reports provide immediate, foundational understandings of the project’s health and progress.
However, the limitations become obvious with scale and complexity. A major limitation is the lack of robust cross-project reporting. While dashboards can consolidate some data from multiple projects, the native reporting features are fundamentally designed for single-project analysis. This creates a significant blind spot for organizations that need a holistic view across multiple teams and initiatives.
When Built-In Features Aren’t Enough
The journey from a small team to a large, multi-team organization is a common one. As a team grows, its reporting needs evolve from simple tracking to sophisticated analysis. This is where the limitations of built-in reports become a critical roadblock. A mature team will start asking questions that standard reports simply cannot answer. Here are some examples:
In-Depth Time Tracking: Standard Jira reports do not have the functionality to account for custom working hours or calendars, leading to misleading or inaccurate metrics. They struggle to answer questions like, “What is our average resolution time for customer support tickets, and can we exclude weekends, holidays, and lunch breaks from that calculation?”
Manual and Reactive Reporting: Without proper tools, teams can spend hours manually updating tickets and struggling with spreadsheets, turning reporting from a valuable activity into a time-consuming burden. This reactive approach slows down operations and shifts the focus away from delivering value and toward “feeding the reporting machine.”
Limited Customization and Visualization Options: Jira reporting has limited customization options and functionality compared to professional business intelligence (BI) tools or third-party add-ons. The provided visualization and data options are often “not good enough” for telling compelling data stories or driving change within an organization.
Elevate Your Jira Reporting with Timepiece – Time in Status for Jira
When built-in reports aren’t enough, a specialized solution is necessary to fill the gaps. The Timepiece – Time in Status for Jira app is designed to solve one of Jira’s most fundamental limitations: accurate time tracking and workflow analysis. Timepiece replaces guesswork with data-driven clarity, transforming raw Jira history into the detailed, accurate, and actionable insights that native reports simply cannot provide.
By using your issue history, Timepiece automatically calculates critical process metrics and uncovers hidden inefficiencies that native Jira reports can’t show.
Identify Workflow Bottlenecks
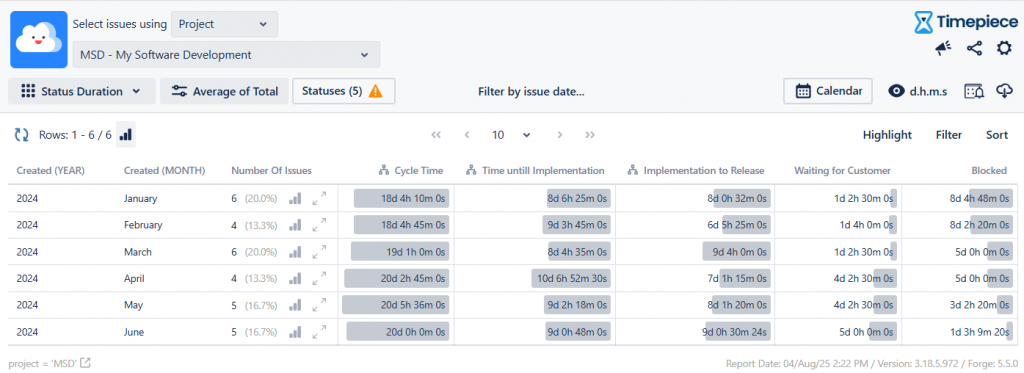
Time in Status Report shows exactly how long each issue spends in every workflow status. This immediate visibility helps you pinpoint where work is getting stuck, allowing you to have data-driven conversations about how to improve flow.
Unlock Deep Insights with Trend Analysis
Individual data points are useful, but real insights come from trends. With Timepiece, you can calculate key statistics like averages and medians, then group the data by week or month to visualize how your team’s performance is changing over time. If you spot an outlier, you can immediately drill down to see the specific issues behind it.
Solve the Accuracy Problem with Custom Calendars
The biggest flaw in standard Jira reporting is the inability to distinguish between working and non-working time. Timepiece solves this with custom calendars, allowing you to exclude weekends, holidays, and even lunch breaks from your calculations. This ensures your metrics like Cycle Time and Resolution Time are always based on true business hours.
Master Agile Metrics with Precision
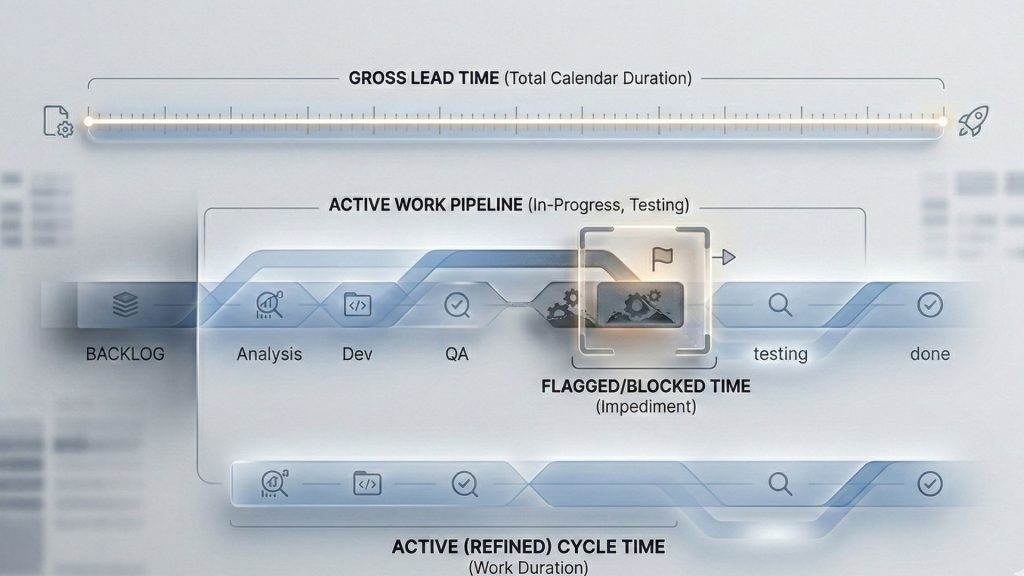
With the Duration Between Statuses Report, you can define your own metrics with unparalleled flexibility. This report measures the time between any two points in your workflow, allowing you to get precise metrics like Cycle Time, Lead Time, and Resolution Time.
Identify Rework and Inefficiencies
Back-and-forth transitions between statuses are a clear sign of rework. The Status Count Report helps you identify this problem by showing exactly how many times each issue has moved into a specific status, allowing you to find the root cause of the rework.
Balance Workloads with Visibility
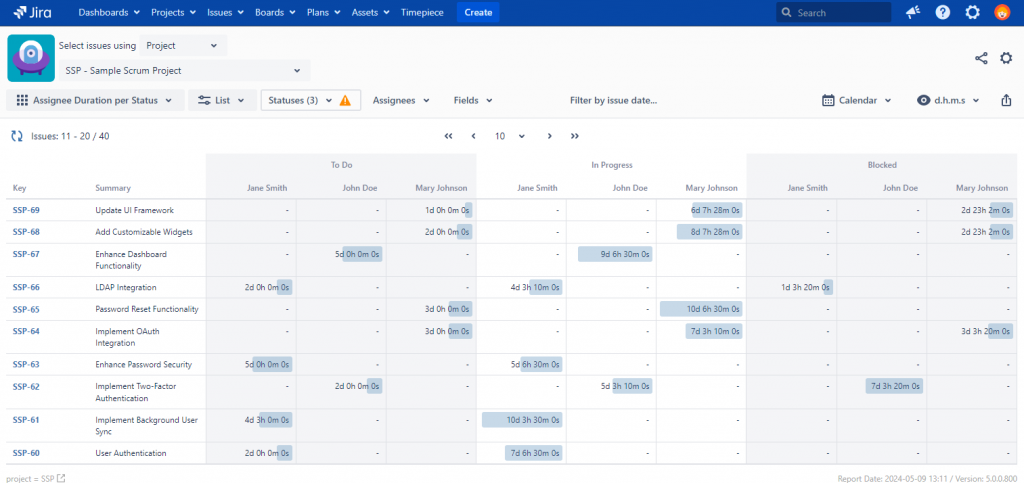
Timepiece’s Assignee Time Report shows how much time each issue spent assigned to each person, allowing managers to identify overloaded team members, rebalance work, and ensure tasks are distributed fairly.
Automate Your Reports and Set Alarms
The Scheduled Reports & Alarms feature automates your reporting process, saving you time and ensuring consistent updates. The Alarms functionality turns Timepiece into a proactive early warning system, allowing you to set custom alerts for conditions like an issue staying in a status for too long. This helps you address critical issues before they escalate.
To visit Timepiece – Time in Status for Jira’s Atlassian Marketplace page, click here. Or, click here to book a demo meeting with our experts and see your real workflow.