Trends change, just like the world. But, in business, some questions are always more important than others. ‘When will it be done’ is one of them. You can deliver pizza or develop an app for millions of users; getting a better answer to this question is the key to a better workflow. Why? Being truly agile isn’t just about being busy; it is also about being predictable.
This guide will explore the two most important metrics for answering this question: Cycle Time and Lead Time. These aren’t just buzzwords; they are tools that help teams see their process clearly, find the real causes of delays, and build a delivery system that is not just fast, but predictably fast.
What is Lead Time in Jira?
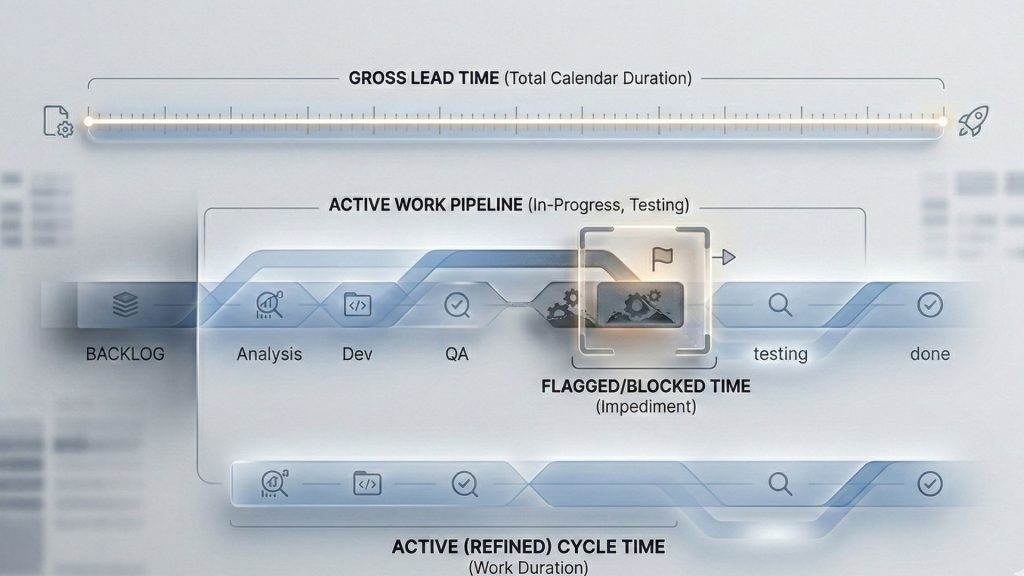
Lead Time is the total time from when a customer or stakeholder makes a request until that request is fulfilled and delivered. In Jira, this usually means the time from when an issue is created until it is resolved.
This concept, which comes from Lean manufacturing, represents the customer’s entire waiting period. It includes every stage, such as:
- Time waiting in a backlog to be prioritized.
- Time in a queue waiting for the team to have capacity.
- Time in active development and testing.
- Time waiting to be deployed.
Lead Time is the ‘customer’s perspective’ metric. It directly answers their main question: ‘How long did I have to wait to get what I asked for?’ Because it gives a complete view of the entire system, it’s a key metric for project managers and business leaders who focus on planning and customer satisfaction.
What is Cycle Time in Jira?
Cycle Time is the ‘team’s perspective’ metric. It answers the internal question: ‘How long does it take us to finish a task once we start?’ It is a direct measure of how efficient the hands-on work is.
Cycle Time is a part of Lead Time. It measures the time from when the team actively starts working on an issue until the work is finished and ready for delivery. In a standard Jira workflow, the Cycle Time clock starts when an issue moves from a ‘To Do’ status to an ‘In Progress’ status and stops when it enters a ‘Done’ status.
A key detail that is often missed is that Cycle Time includes all the ‘wait times’ that happen during the active development process. For example, if a task is being worked on, then it has to wait for a code review, waiting for customer’s answer or purchasing department; all of that waiting is part of the Cycle Time.

What’s the Difference Between Cycle Time and Lead Time?
Let’s explain the differences with an analogy. Let’s assume your Jira board is an airport terminal:
Lead Time is the entire passenger journey. It starts the moment a passenger books their ticket (an issue is created in Jira’s backlog) and ends when they arrive at their final destination (the issue is marked ‘Done’). This includes all the waiting at home, the journey to the airport, and waiting at the gate while drinking your coffee.
What about Cycle Time? It is the actual flight. It starts only when the plane takes off (the issue moves to ‘In Progress’) and ends when the plane lands (the issue reaches ‘Done’). Even if it’s a connecting flight with a layover, that’s all part of the active journey. So, Cycle Time includes all the waiting that happens ‘after’ work has begun.
Why Should You Track Both Metrics?
Tracking both agile metrics, Lead Time and Cycle Time gives you a powerful way to check the health of your workflow process. By comparing them, teams can see where their improvement efforts will have the biggest impact. So, to identify bottlenecks and optimize your workflow, both Cycle Time and Lead Time are vital.
What short or long Cycle Time mean for your workflow?
Scenario 1: Long Lead Time, Short Cycle Time
First, the good news. Short Cycle Time means your development process and team are very efficient once they start working. But, the problem is outside of the development process itself. Work is likely getting stuck before it starts. The reason for this could be in prioritization, planning, or communication.
Scenario 2: Long Lead Time, Long Cycle Time
This points to problems throughout the entire process, especially during active development. A long Cycle Time means your team is facing issues like unclear requirements, switching between tasks too often, or delays from slow code reviews and testing. So, it means there is a problem or problems you need to pay attention to.
To achieve better workflow, more efficient process management, and improve team performance, the main goal must be to reduce both metrics.
How Do These Metrics Improve Business Performance?
Tracking Cycle and Lead Time is not just for show; it provides real business value. Using these metrics helps organizations manage their development process as a predictable system, leading to better performance.

How Can You Find the Real Bottlenecks in Your Workflow?
One of the best things about these metrics is their ability to show the difference between active work time and idle wait time. By seeing how much time issues spend in statuses like ‘Blocked’ or ‘Waiting for Review’, teams can find exactly where their process is breaking down. This changes conversations from ‘code reviews feel slow’ to ‘our data shows issues spend an average of 48 hours in ‘In Review’, which is 40% of our Cycle Time.’ This precision helps teams target the biggest delays.
How Can You Create More Accurate Project Forecasts?
For stakeholders, predictability is often as important as speed, if not more important. Historical Cycle and Lead Time data provide a solid, statistical way to forecast when work will be done, which is much more reliable than guessing. Instead of giving an often-wrong date, teams can use their data to say things like: ‘85% of tasks like this are completed within 10 days of starting.’ This approach builds trust and allows for better planning.
How Do You Know if Your Process Changes Are Working?
How can a team tell if a change was a real improvement? Flow metrics give the answer. By measuring Cycle Time before and after a change, teams can get a clear, data-driven answer. Did the time in the ‘Testing’ status go down? The data provides an objective reply and helps create a culture of making smart decisions.
How Can These Metrics Help Build a Better Team Culture?
When everyone can see these metrics, the whole team gets a clearer picture of how the workflow is doing. This kind of transparency builds a sense of shared ownership. If a bottleneck shows up, the focus moves away from pointing fingers and toward looking at the process together. The conversation becomes, “What in our workflow is causing this delay, and how do we fix it?” That mindset is the starting point for a healthy, high-performing team.
Measuring Cycle and Lead Time: Jira’s Built-in Tools and Their Limitations
Jira offers built-in reporting tools that provide a starting point for measuring your flow metrics. However, these tools come with important nuances and limitations that can lead to inaccurate conclusions if not properly understood.
The Control Chart: Visualizing Process Flow
The Control Chart is Jira’s primary tool for visualizing team efficiency and process stability. It maps the total time each issue spends within specific workflow statuses that you select.
While useful, the Control Chart has one critical limitation:
The 24/7 Calculation: The chart can be configured to exclude non-working days like weekends and holidays. However, it calculates elapsed time based on a 24-hour day, not a configurable 8-hour workday. This means if an issue stays “In Progress” overnight, the report will include all non-working hours in its calculation. This can significantly inflate your time metrics and make them appear longer than the actual effort spent.
The Cycle Time Report: A Specialized DevOps Metric
Jira also has a “Cycle Time Report,” but it measures something fundamentally different from the Control Chart. This report is designed for teams with mature DevOps practices and has a rigid definition of cycle time: the period from the first code commit associated with an issue until that code is shipped to a production environment.
This report comes with two major limitations:
Inflexible Definition: The report’s definition of cycle time is fixed and cannot be customized to match your team’s internal workflow statuses. It is only useful for measuring deployment speed, not process efficiency.
Technical Conditions: The report cannot function unless a Jira administrator has integrated your instance with source code management (like Bitbucket or GitHub) and CI/CD tools (like Jenkins). This makes it unusable for any team that only uses Jira for workflow tracking.
Relying on native Jira reports without understanding these key details can mean making important decisions based on incomplete or inflated data.
How Can You Accurately Measure Cycle and Lead Time in Jira?
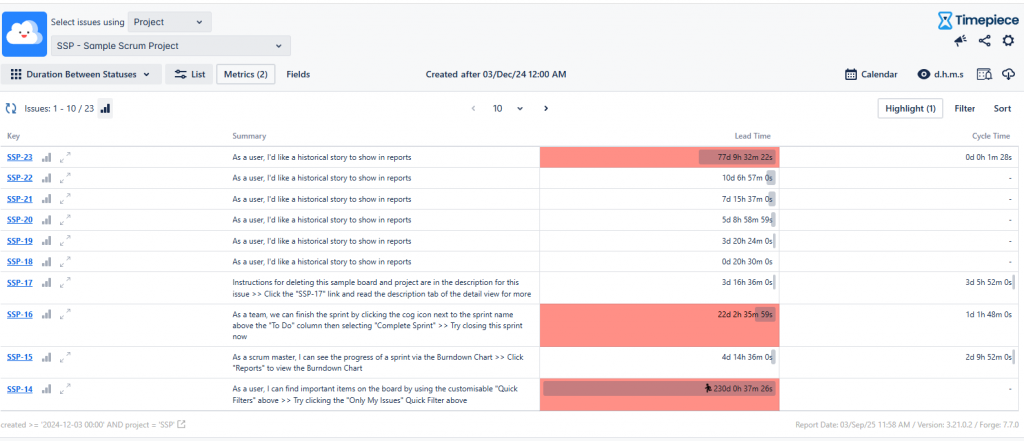
Given the problems with Jira’s native reports, teams that are serious about improving their process need a professional alternative. The solution must be accurate, flexible, and provide deep insights. This is where Timepiece – Time in Status for Jira by OBSS steps up. Timepiece was built to solve the exact problems that affect Jira’s native tools.
Define Metrics That Match Your Unique Workflow
Timepiece – Time in Status for Jira lets you define your metrics to perfectly match your workflow. Using a simple interface, you can create ‘Status Groups’ or ‘Consolidated Columns’. This allows you to drag and drop any combination of statuses to define what ‘Cycle Time’ or ‘Lead Time’ means for your team.
Custom Calendars
Timepiece solves the 24/7 calculation problem. The app has a custom calendar function where you can define your team’s working hours, workdays, and even add holidays or lunch breaks.
Easily Calculate Re-Opened Issues
This is a game-changing feature. Unlike Jira’s native reports, Timepiece is built on the full issue history. It accurately adds up the total time an issue spends in any status, no matter how many times it goes back and forth. This provides a trustworthy calculation that reflects the complete effort for every issue.
Can You Analyze Past Projects Immediately?
A big advantage of Timepiece is that it delivers value right away. Because the app uses existing issue history, it can generate accurate reports on all your past issues the moment it’s installed. You don’t have to wait to collect new data.
How Can You Get Deeper Insights from Your Data?
Timepiece offers a full suite of report types to help you find the root causes of delays. Key reports include but not limited to:
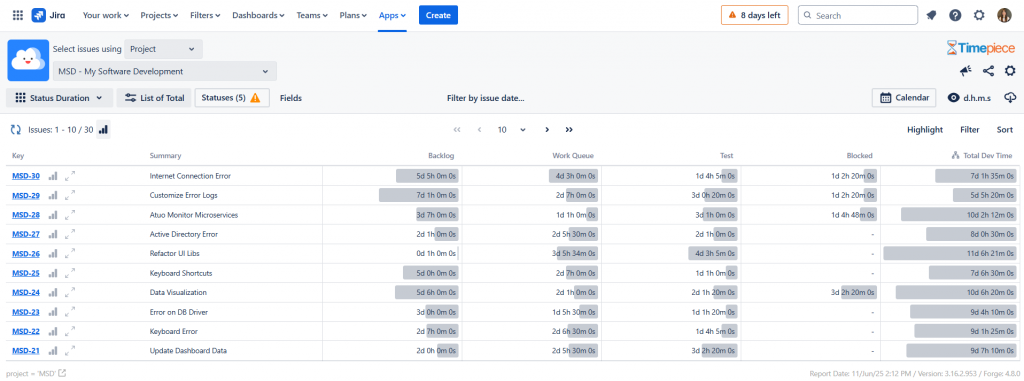
- Time in Status
- Assignee Time
- Group Time
- Duration Between Statuses
All reports can be grouped by any Jira field (like issue type or priority), allowing for powerful analysis that is impossible with native tools.
How Can You Make These Metrics Visible to Everyone?
For metrics to drive change, they need to be visible. Timepiece provides customizable gadgets that can be added to any Jira dashboard, making key metrics accessible to the whole team. For advanced needs, Timepiece also offers a REST API, allowing you to pull clean, accurate data into external tools like Power BI or eazyBI.
What Are Practical Ways to Reduce Cycle and Lead Times?
Getting accurate data with a tool like Timepiece is the first step. The next step is to use those insights to make real improvements.
How Does Limiting Work in Progress (WIP) Help?
One of the best ways to reduce Cycle Time is to limit how much work the team handles at once. Setting Work in Progress (WIP) limits, a key part of Kanban, forces a team to finish tasks before starting new ones. This simple rule helps the team focus and encourages collaboration to get work done, improving the overall flow.
How Should You Handle Blockers and Wait Times?
Detailed reports from Timepiece will show you which statuses are causing the longest waits. These are your bottlenecks. Armed with this data, teams can create policies to reduce these delays, such as daily reviews of all blocked issues or setting team goals for code review durations.
Why is it Important to Break Down Large Tasks?
Smaller tasks flow through a system faster and more predictably. A common cause of long Cycle Times is trying to handle user stories that are too big. Teams should get in the habit of ‘slicing’ work into the smallest possible pieces that still deliver value. This improves flow and allows for faster feedback, leading to higher quality. You don’t eat the whole pizza at once, do you?
How Can You Speed Up the Time Before Work Starts?
The gap between Lead Time and Cycle Time is a huge opportunity for improvement. To shrink this gap, teams need to focus on the health of their backlog. This means regular backlog grooming sessions to ensure upcoming work is well-understood and has clear requirements.
Ready to Turn Your Jira Data into a Competitive Advantage?
The journey to becoming a high-performing, predictable team starts with measurement. Cycle Time and Lead Time are the vital signs of your workflow. But the data is only as good as the tools you use to collect it.
Jira’s native reports are plagued by flaws that can lead to bad decisions. A purpose-built, professional tool like Timepiece – Time in Status for Jira provides the solution and delivers the data integrity your team needs.
Gain the clarity and confidence you need to build a truly predictable delivery pipeline. Start your free trial of Timepiece – Time in Status for Jira today and see your real workflow, accurately.