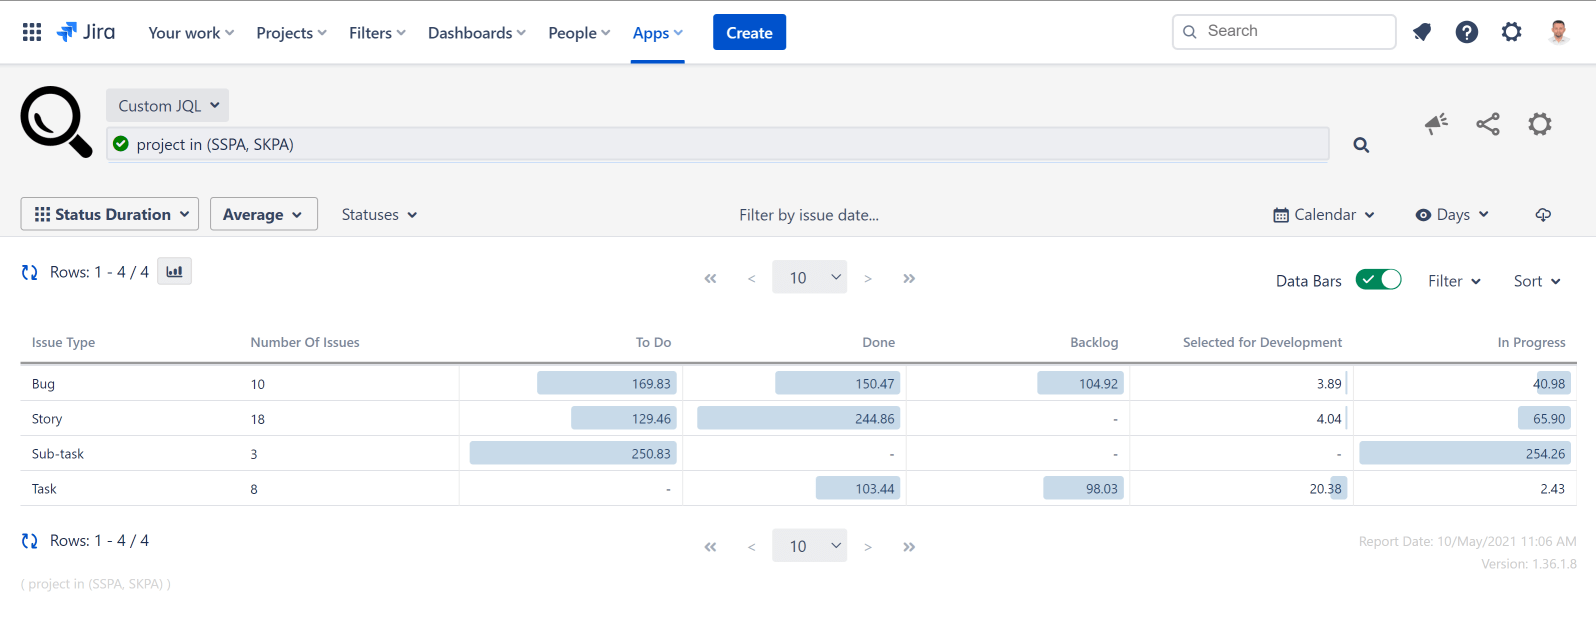
Today, we are releasing a new feature for Cloud and on-prem (Server/DC) platforms at the same time. Data Bars is a new way to visualize report values without using charts.
You might be familiar with Excel Data Bars. This new feature works in Time in Status in a similar fashion.
Time in Status report output shows numeric values but it is hard to compare them visually. When Data Bars are enabled, a bar will be displayed in each table value cell in the report and the length of the bar will be proportional to the value in the cell (compared to the largest value on the page). This way, it will be very easy to get a grasp of values in the report.

Simple and effective.
Documentation for Data Bars on Time in Status Cloud can be found here and for Server/DC can be found here.
As always, feel free to reach us through plugin@obss.com.tr or pluginsupport.obss.com.tr if you have any questions or suggestions.

