Hello Everyone,
We have two major features for Jira Server and Data Center editions of Time in Status this week.
Column Consolidation
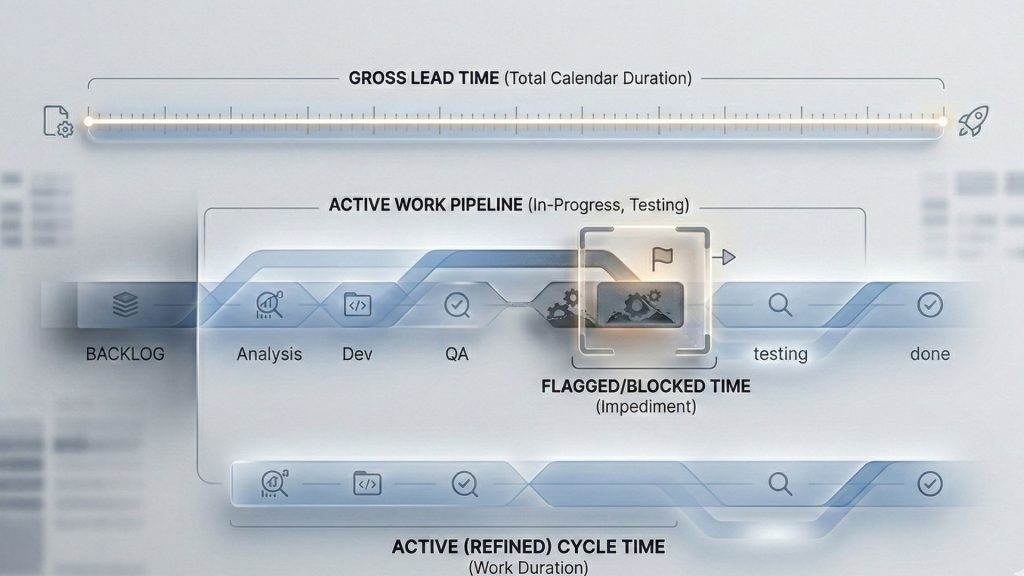
Column Consolidation is something that is available on Jira Cloud for some time and our customers have been asking for the server version. With Time in Status 4.8.0 it is now available.
Using the very same Status selection panel, you can now create Consolidated Columns and put multiple statuses under them. The column will display the sum of durations of all statuses selected for that column.

This feature is particularly useful for calculating metrics like Lead Time, Cycle Time, etc.
You can add multiple consolidated columns to each report and these columns can be ordered like any other report column.

You can see the documentation page for the details,
Consolidated columns will also work just as well in SUM and AVERAGE reports, described below.
Average reports through the UI
Up until this release, average durations were only calculated for file exports and were available only through file exports. With Time in Status 4.8.0, we are making average (and sum) reports available from the UI.
A new button is added to the toolbar, right next to Report Type selection and allows you to select List / Average / Sum options.
When Average or Sum is selected, you will also be able to select tissue fields to group your issues by.

The report output will contain the average or total durations for all the issues in the report, grouped by the issue fields you picked.

You can see the documentation page for the details,
As always, you can find Time in Status in its Atlassian Marketplace page and reach us through plugin@obss.com.tr if you have any questions.


