In Agile, continuous iteration is crucial. To measure progress, some Agile metrics are more important than others. Cycle Time and Lead Time are two of these metrics. To see what is working, what holds you back and what are the biggest blockers, you need to track Cycle Time and Lead Time, and track them precisely.
The math is simple: For Scrum or Kanban teams, Cycle Time and Lead Time are critical indicators of team velocity and engineering efficiency. And if your data is misleading, you are not measuring the performance correctly. To overcome this, many teams use Jira’s Flagging feature to signal these impediments.
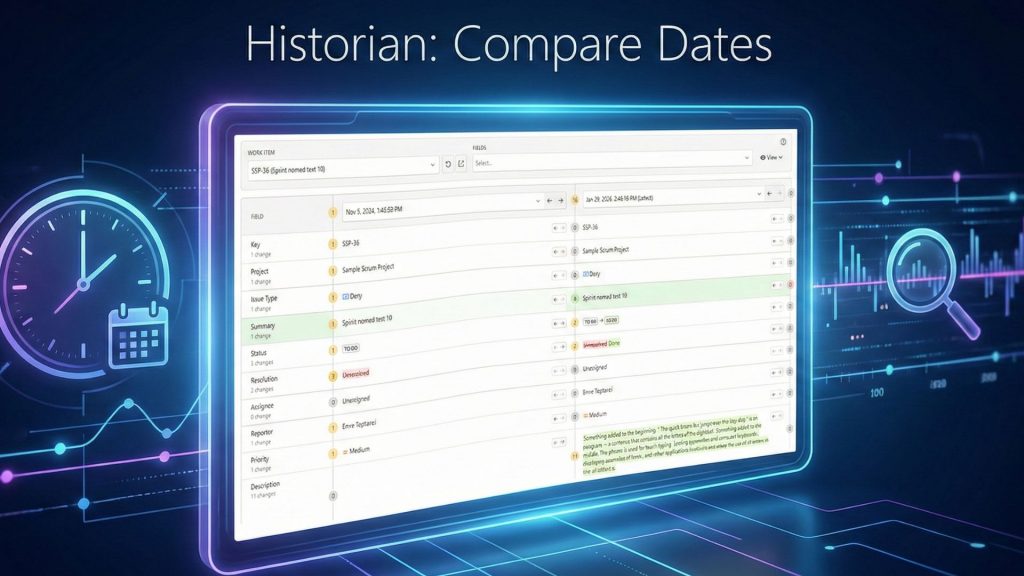
With Timepiece – Time in Status for Jira, you can easily isolate this blocked time and calculate a refined “Active Work Time” metric. Here is a step-by-step guide to setting this up.
Step 1: Configure Custom Calendar
Before calculating blocked time, ensure your clock isn’t counting weekends or holidays. Jira’s native reports typically use a 24/7 clock, which skews data.
Navigate to Settings > Apps > Timepiece > Calendar Settings.
Define a Custom Calendar that reflects your team’s actual working hours (e.g., Mon–Fri, 8:00 AM – 5:00 PM).
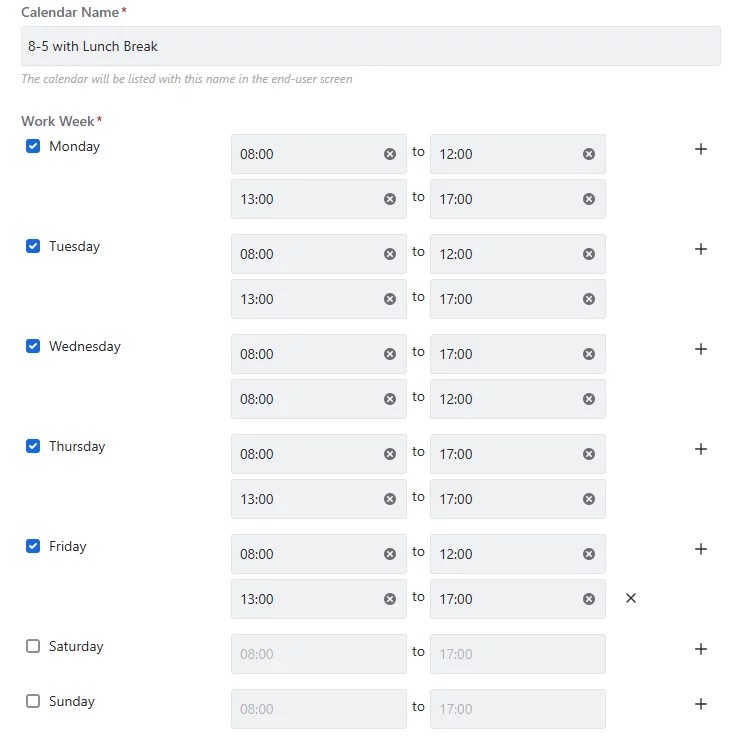
Timepiece will now calculate all durations, including blocked time, based only on these active hours. To learn more about the custom calendar in Jira and why it’s crucial, check out our latest blog post.
Step 2: Track the “Flagged” Field Duration
The core of this solution lies in the Timepiece’s Any Field Duration report. Unlike standard reports that only track status transitions, Any Field Duration can measure how long any field held a specific value.
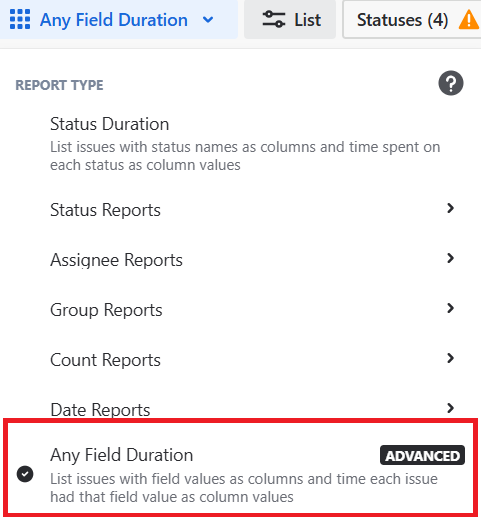
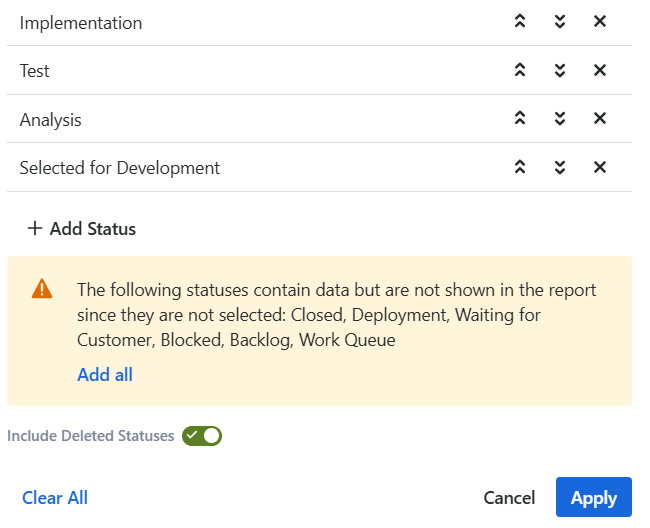
In the Report Type menu, select Any Field Duration. Then, add your active statuses (e.g., Implementation, Test, Analysis). These are the statuses whose duration will be included in the report. So, to see flagged time against your Cycle Time, make sure you are adding only active statuses.
Pro Tip: If you want to see Lead Time, add all waiting statuses like Backlog or Waiting for QA.
To explore Cycle Time and Lead Time in Jira in greater depth, we’ve published a comprehensive blog post that covers the topic from every angle.
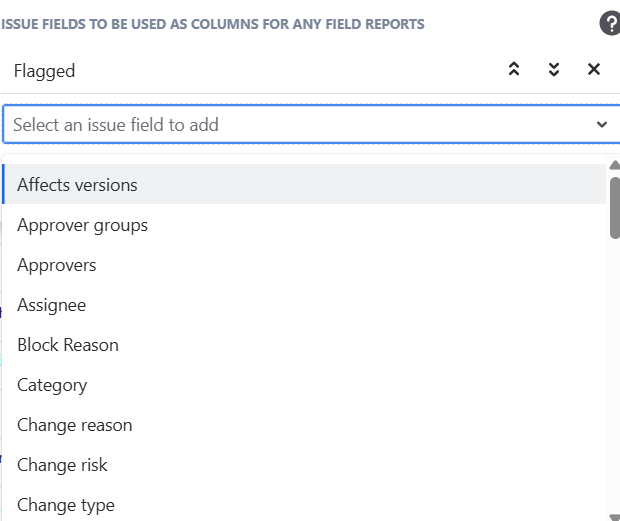
Step 3: Configure History Field
Now, it is the crucial part. Click the History Field button next to Statuses and select Flagged.
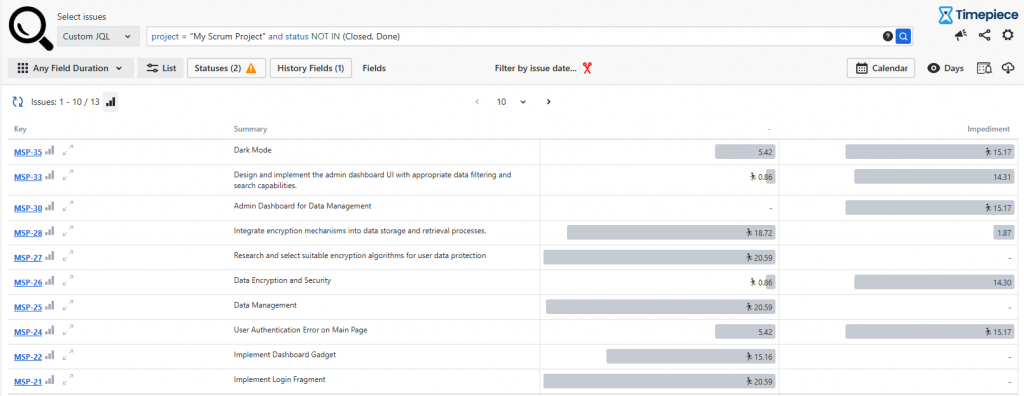
Once you click ‘Apply’, Timepiece analyzes your existing Jira history to calculate exactly how long issues were flagged versus unflagged. In the screenshot below, the column with (-) shows the total duration of the unflagged time and the column ‘Impediment’ shows the total flagged time.
Step 4: Analyze Impediments Across Sprints
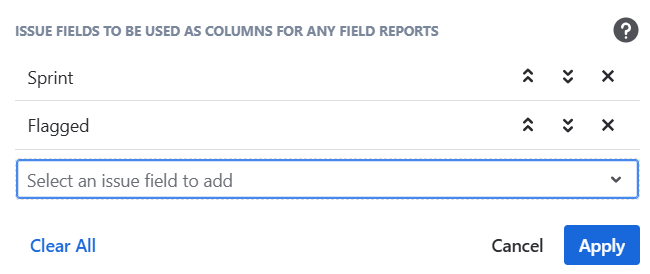
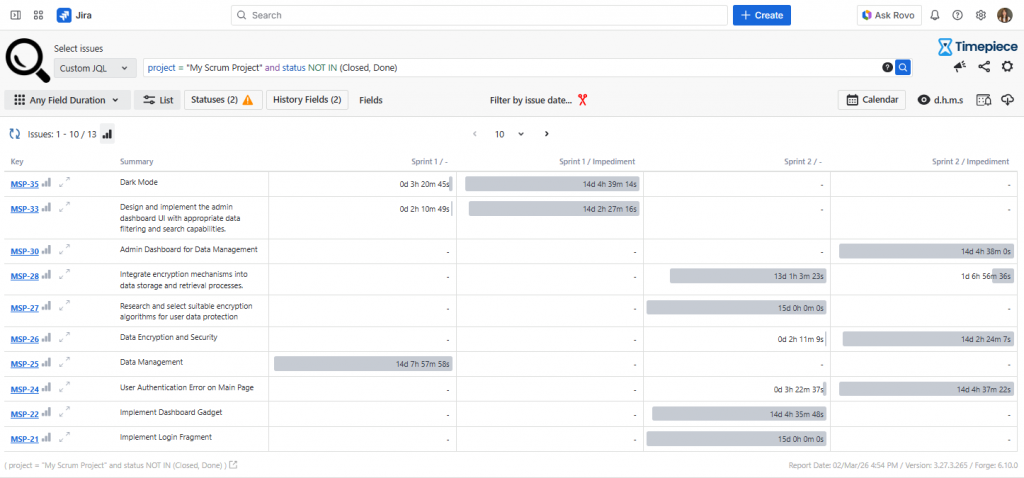
One of the strongest advantages of the Any Field Duration report is the ability to include multiple custom and system fields in the calculation. This gives you the flexibility to configure the report as deeply and precisely as your use case requires. A common example of this is adding the Sprint field to the calculation. To analyze your Sprint performance, you can add Sprint to the History Field along with Flagged.
This provides a granular view of which tasks were the most problematic during a specific Sprint.
Generate Reports with Timepiece Assistant
Configuring complex reports shouldn’t be a bottleneck. Timepiece Assistant uses AI to turn your natural language questions into instant report configurations. Instead of manually filtering for fields and statuses, you can simply ask the Assistant to do the work for you using a query related to your specific project:
“Analyze ‘My Scrum Project’ and show me the total duration issues that were Flagged as an Impediment. Group the results by Sprint so I can calculate our true Cycle Time.”
The Assistant handles the heavy lifting, providing a ready-to-use link with the correct project, statuses, and field filters already applied. This makes sophisticated metrics accessible to everyone on the team, regardless of their technical expertise.
Conclusion: Precision Over Guesswork
Agile excellence is built on data-driven transparency, not raw estimates. By isolating Blocked Time through a rigid Time in Status audit, you gain the clarity required for a professional bottleneck analysis. Deducting these impediments from your Cycle Time reveals your true Active Work Time, allowing you to separate team velocity from external delays. This level of precision empowers teams to eliminate hidden waste and build a predictably fast delivery system. Stop letting the standard 24/7 clock skew your performance and start mastering your actual engineering flow.
To learn more about Timepiece, visit its Atlassian Marketplace page. You can also see the official Timepiece documentation page or book a demo meeting. You can try Timepiece for free for 30 days, and it is free for up to 10 users.