For mature agile teams, sprint velocity is a familiar metric, but it only tells part of the story. A stable velocity can often mask underlying process inefficiencies. To achieve true workflow optimization, teams must ask deeper questions: Is our Cycle Time for complex tasks improving? Are we becoming more efficient sprint over sprint? Answering these questions requires a more granular level of Jira reporting.
The ultimate goal for many teams is a multi-dimensional report that tracks Cycle Time based on story point across multiple sprints. This analysis provides unparalleled insight into team performance and pinpoints bottlenecks with precision. However, generating such a report is notoriously difficult with Jira’s standard toolset, which often lacks the flexibility to combine these specific metrics.
This is where a dedicated reporting solution becomes essential. This guide will walk you through the exact steps to build this powerful report using Timepiece – Time in Status for Jira, transforming your raw data into a strategic asset for process improvement.
How to Build Your Advanced Sprint Report in Timepiece
The foundation of our report is Timepiece’s versatile Duration Between Statuses report. By configuring this single report type in three simple steps, we can achieve the detailed analysis we need.
Step 1: Isolate Your Sprints with the Trim History Feature
To get an accurate picture of recent performance, you must first focus your analysis on a specific timeframe, like your last 3 sprints. Issues that have existed for a long time can carry historical data that skews your sprint-specific metrics.
Timepiece’s Trim History feature solves this problem. It allows you to set a start and end date, effectively trimming the history of each issue to only include activities within that period. This creates a clean, relevant dataset.
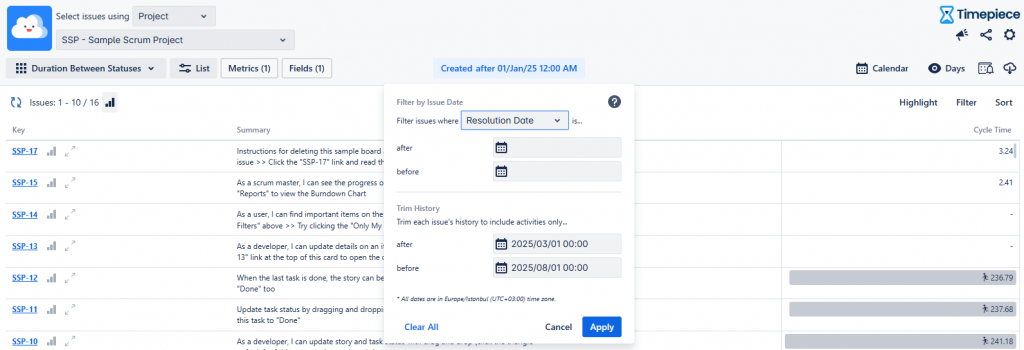
In the date selector panel, simply choose the Trim History option and input the date range that covers your target sprints.
Step 2: Define and Calculate Sprint Cycle Time
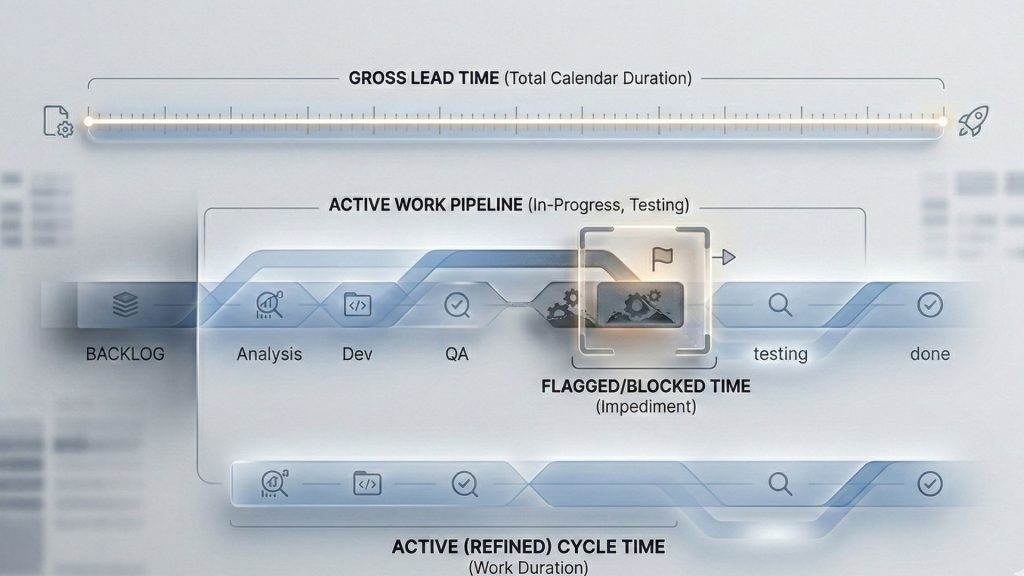
Next, you need to define what Cycle Time means for your team. Generally, it’s the time from when work begins on an issue until it’s completed, excluding any time spent waiting in the backlog.
In Timepiece, you can calculate this easily within your report. Simply use the Statuses selection panel to choose only the statuses that represent active work, like ‘In Progress’ or ‘In Review’.
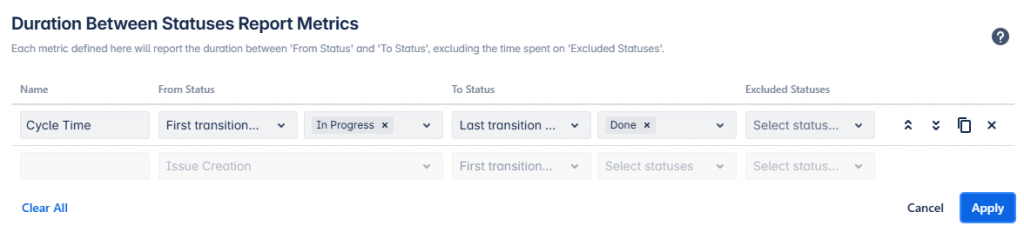
By including only these active statuses, you are telling Timepiece to calculate the total time an issue spent working towards completion, giving you a true and accurate Cycle Time for every issue.
Step 3: Group by Story Point and Analyze the Average
At this point, you have the raw Cycle Time for every issue. The final step is to aggregate this data into a meaningful summary.
Navigate to the Report Options panel and change the report type from List to Average. This tells Timepiece to calculate the average time instead of listing individual issues. Finally, use the Group By dropdown menu and select Story Points and Sprint.
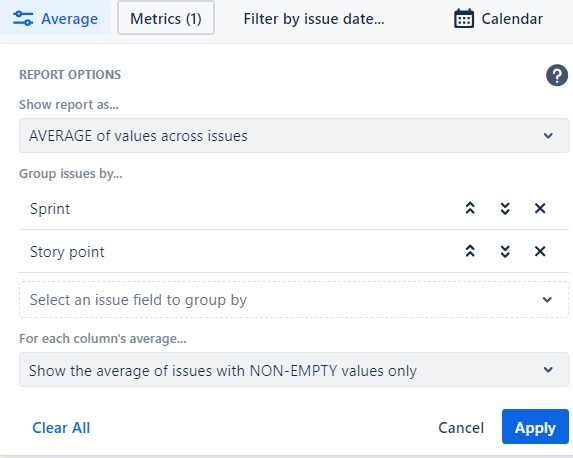
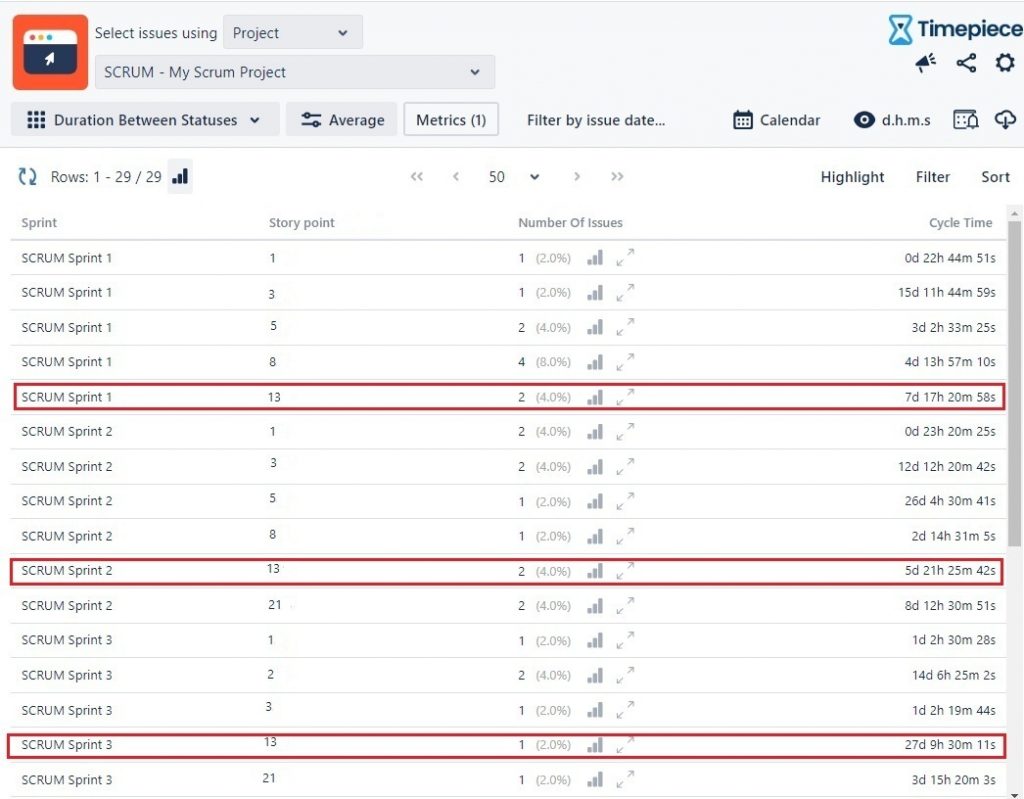
Timepiece will now automatically group issues by their story point value and display the Average Cycle Time for each group, smoothly organized by sprint.
From Data to Decisions with Interactive Analysis
The report you’ve built is more than a static overview; it’s a dynamic tool for discovery. You can easily track performance trends for different task sizes over time. But its true power is revealed when you investigate anomalies.
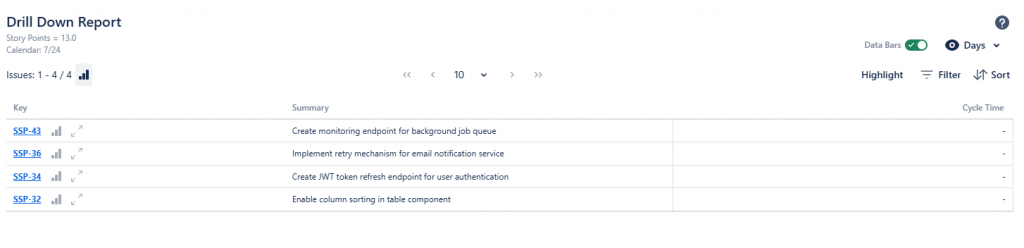
If you notice an unusually high Average Cycle Time for 5-story point tasks in a recent sprint, you don’t have to guess why. Timepiece’s Drill Down feature makes every number interactive. Clicking on any average value instantly reveals a detailed list of the specific Jira issues used in that calculation. This allows you to move seamlessly from a high-level observation to a granular investigation, identifying outlier issues and understanding the root cause of delays.
The Strategic Advantage of Deeper Insight
Building this report is about more than just numbers; it’s about empowering your team to work smarter.
Enhanced Predictability: With a clear understanding of how long different-sized tasks take, you can make more accurate forecasts and manage stakeholder expectations better.
Targeted Improvements: The report acts like an MRI for your workflow, pinpointing exactly where inefficiencies lie. This allows you to focus your improvement efforts where they’ll have the most impact.
A Data-Driven Culture: When discussions are based on objective data, teams can move past guesswork and focus on improving the system. This fosters a culture of accountability and continuous improvement.
To explore these features for yourself, find Timepiece – Time in Status for Jira on the Atlassian Marketplace and start a free trial. For a guided tour, you can also schedule a demo with our experts.