Tracking your team’s KPIs in Jira is often not an easy task. Especially, when you are aware that KPIs, or any metrics, are not a goal, they are tools. You just want to answer simple questions: Are we getting faster? Where are our bottlenecks? How long did that actually take?
But when you try to find the answers, you may hit a wall. You want to track “Cycle Time,” but Jira’s built-in report has a rigid, technical definition that doesn’t match your team’s workflow.
So, you think ‘’let’s try a dashboard gadget” and you attempt. But the numbers look wrong. A task that sat in “Test” over the weekend shows up as “3 days,” which you know is nonsense. It’s counting nights and weekends, making all your metrics look inaccurate.
You are a tough person, you are not a quitter, and you go to the next logical step: Jira Query Language (JQL). It’s powerful for finding issues, but it has a hard architectural limit: it is a retrieval engine, not a calculator. If you look at the official JQL Functions reference, you will see functions for filtering by date, user, or status, but you will find zero aggregate functions. There is no AVERAGE or SUM command in the language. You can use JQL to find your 5000 issues, but you cannot ask it to calculate their duration.
The only option left is to export to a spreadsheet. It works, at least kind of works. However, it is a manual, frustrating process that’s already out of date.
This is the exact “reporting gap” in Jira, and Timepiece – Time in Status for Jira is built to solve it. In this guide, you’ll find what a is KPI, how to track the most important metrics with Timepiece that actually matter.
What is KPI? And How Do You Measure It?
A Key Performance Indicator (KPI) is simply a measurable value that shows how effectively your team is achieving its process objectives. In Jira, this almost always comes to one question: “How long?”
- How long did the customer wait for a solution?
- How long did we actually spend working on this?
- How long was this issue stuck waiting for review?
Timepiece is built to answer these questions. Not just to answer, answer them precisely. Let’s break down the essential KPIs you can finally track, analyze, and optimize with Timepiece.
The “Must-Track” KPIs for Agile or Service Team
Cycle Time and Lead Time
Probably, these are the two most important metrics for any team: Jira Cycle Time and Jira Lead Time. And they are famously difficult to get right in Jira.
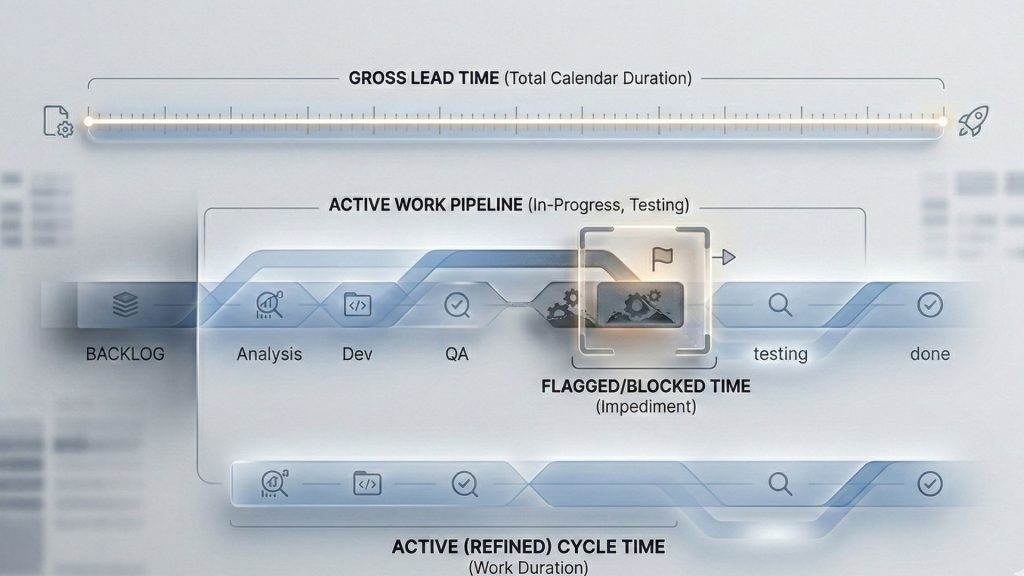
Lead Time is what your customer experiences. It’s the total time from the moment they ask for something to the moment they get it.
Cycle Time is what your team experiences. It’s the time from when you actively start working on a task to when you finish it.
But why track both? Because the gap between them is where your biggest problems may hide. If your Lead Time is 30 days, but your Cycle Time is only 2 days, you’ve just found your bottleneck. Your team is fast, but your planning process is slow.
Timepiece lets you define what these metrics mean for your team, too. Using Duration Between Statuses report, and its Consolidated Columns, you just group your workflow statuses together. For Cycle Time, you only group your active work statuses like In Progress, Test, and In Review.
For Lead Time, on the other hand, you also need to add waiting statuses too, like Backlog, To Do, and Blocked. This flexibility means you can finally create a real, meaningful metric that matches your team’s actual workflow.
Here are a step-by-step guide to track Cycle Time and Lead Time in Jira with Timepiece.
Average Time in Status
You can’t fix a bottleneck until you can find it. The status with the highest average time is the biggest delay in your system. Timepiece is built to make this visible in seconds.
To measure Average Time in Status for Timepiece:
At the top left corner, click the “Report Options Menu”
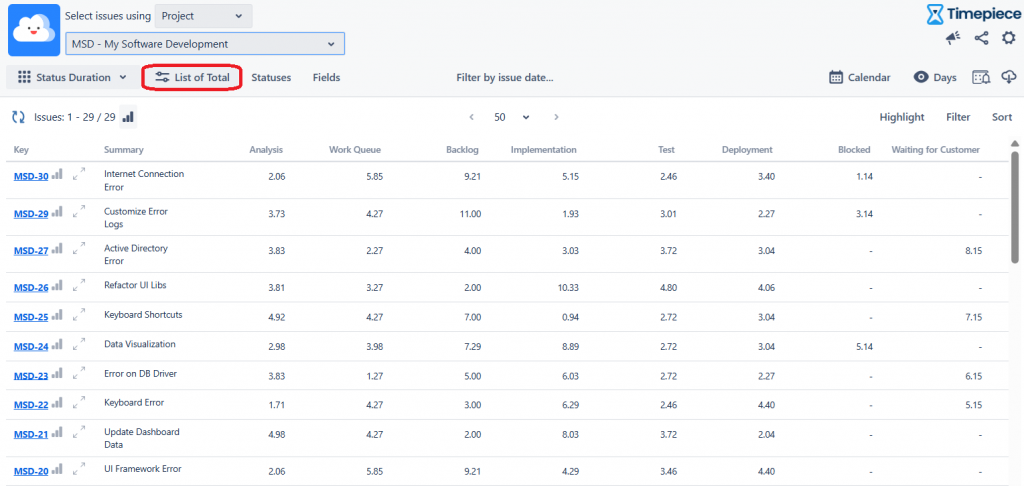
Add time frames like Created Week, Created Month or Created Year.
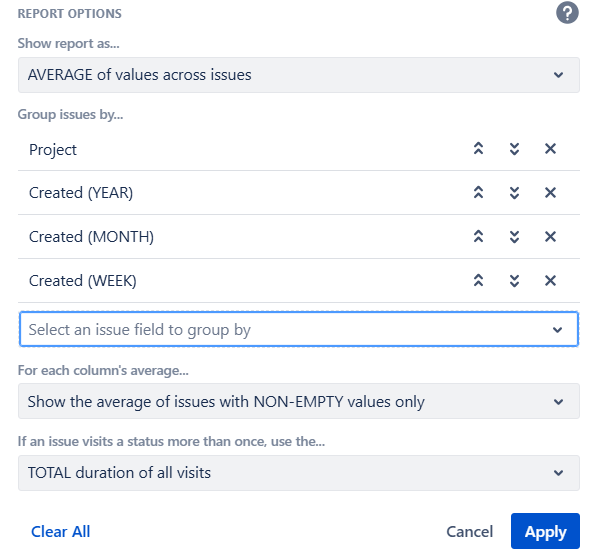
The report instantly pivots from a long list of issues into a simple summary table, showing the average time for every status.
Check out the results now, ‘Blocked’ in January’s first week is your primary bottleneck with 12.14 days.
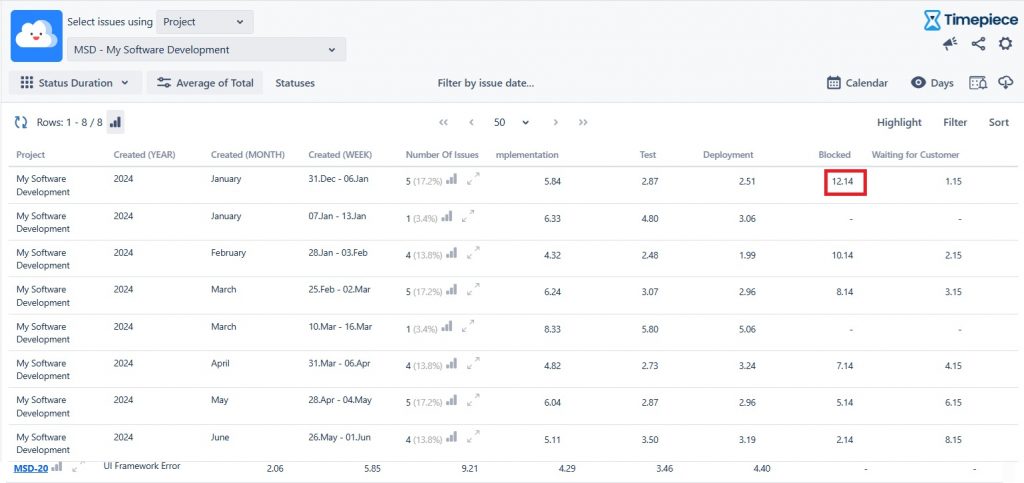
You now have an objective, data-backed starting point for your next team meeting.
Resolution Time & First Response Time
If you’re on an ITSM, service desk, or customer support team, this is your world. These metrics are the heart of your Service Level Agreements (SLAs).
First Response Time: How long from ticket creation to the first human acknowledgment.
Resolution Time: The total time it took to solve and close the ticket.
These are a direct measures of your service quality. Failing to meet your SLAs can have real contractual and financial consequences.
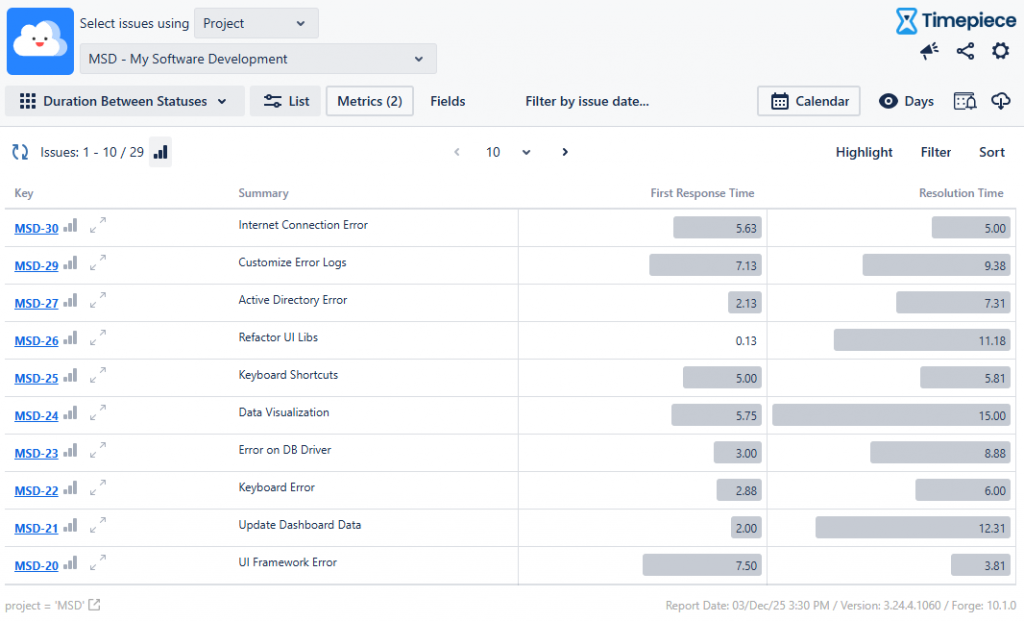
First Response Time
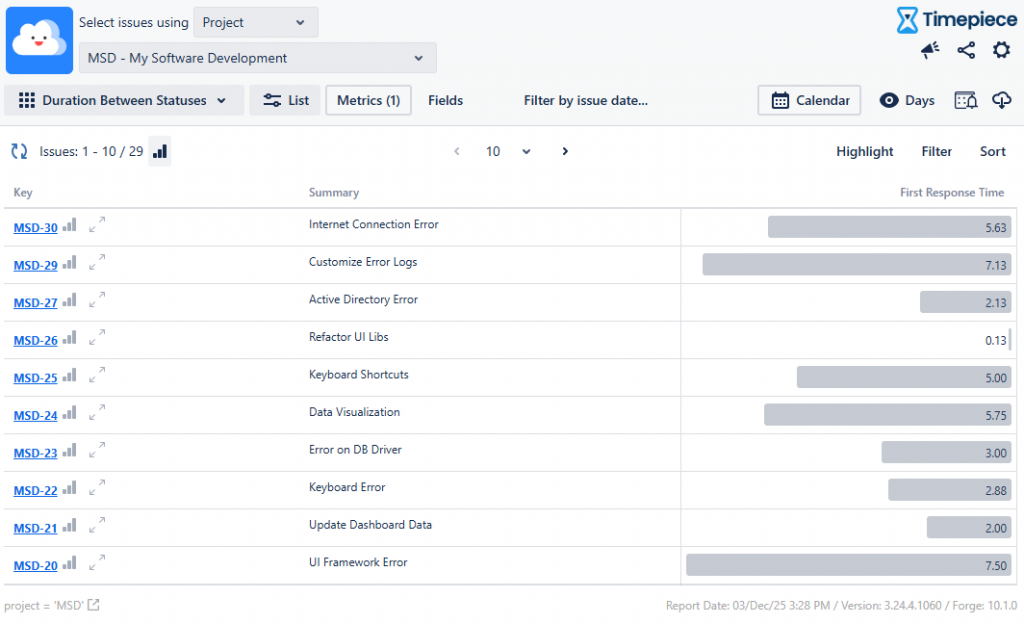
You can use the Duration Between Statuses report. This measures the exact time from a Start Status (like ‘To Do’) to an End Status (like ‘In Progress’).
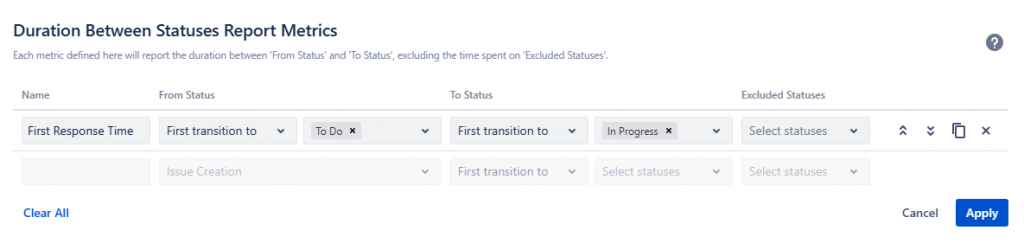
Here is how it looks:
Resolution Time
Use the Duration Between Statuses report, with a consolidated column for all your “active” statuses.
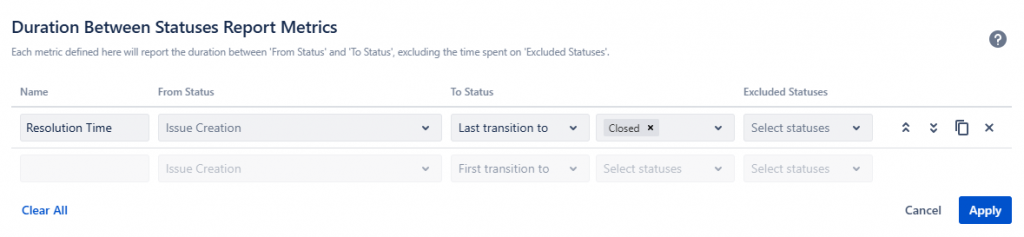
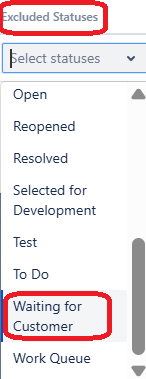
But here is the most critical part: pausing the clock.
Your team shouldn’t be penalized for the time an issue spends in “Waiting for Customer.” Native Jira reports will count this time against you. Timepiece’s report naturally shows “Waiting for Customer” as its own separate line item. This lets you create a true SLA-like metric that excludes external wait times, which are essential for fair and accurate reporting.
There you go. You get the a great view of 2 metrics at once:
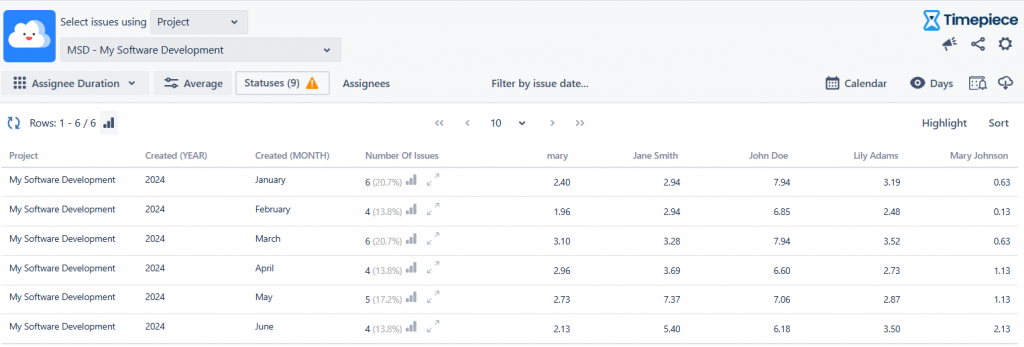
Workload Distribution
This KPI isn’t about process health; it’s about team health. Workload Distribution reports answer, “Is the work distributed fairly, or is one person a ‘hidden’ bottleneck?”
Timepiece’s Assignee Duration Report for a single issue, how long it spent assigned to each user it was ever assigned to. By calculating the average or sum time grouped by user, a manager gets a clear, objective picture of who is carrying the most active work.
Quality & Rework
A fast team that produces a lot of bugs isn’t really fast. Speed is only half the story. These advanced KPIs measure the “hidden factory” of rework, planning failures, and wasted effort.
Rework and sprint spillover are silent “capacity killers.” They eat up team effort that could be spent on new work.
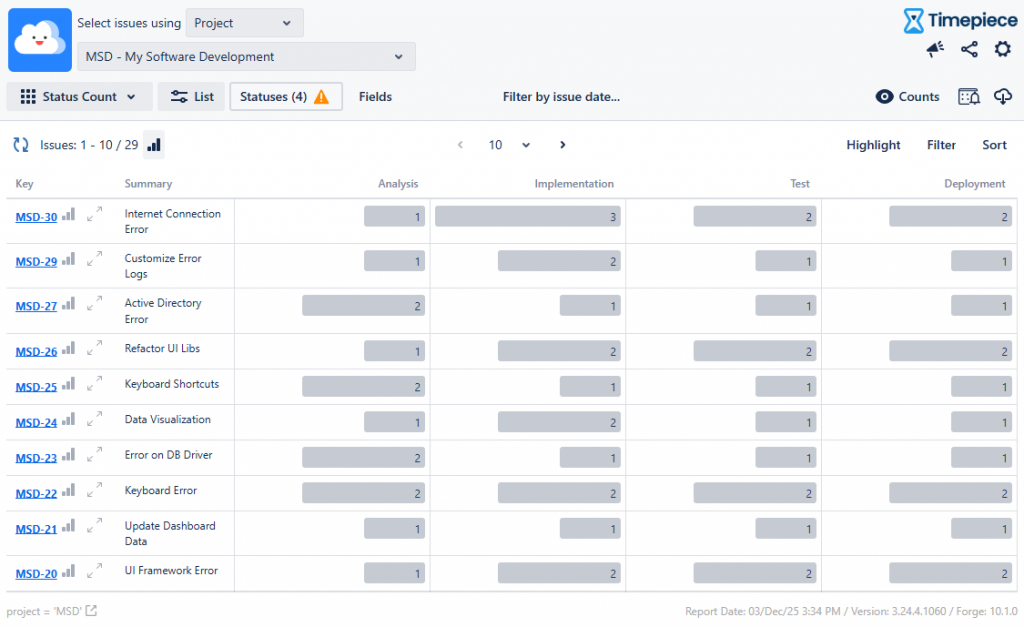
How Timepiece Measures?
The answer is Status Count Report. Instead of measuring time, this report counts how many times an issue entered a given status. If you see an issue with a “Implementation” count ‘3’, you know it failed testing twice and was sent back for rework. This is a direct, quantifiable measure of your quality-related effort.
The Foundation of Trustworthy KPIs: Custom Calendars
All the metrics above are useless if they are inaccurate. This is the single biggest failure of native Jira reporting: it calculates time based on a 24/7 calendar. Timepiece’s Custom Calendar feature solves this completely. You can define your team’s actual working schedule:
Working days (e.g., Mon-Fri)
Working hours (e.g., 8:00 – 17:00)
Holidays, and even lunch breaks. This one feature is the difference between misleading data and trustworthy intelligence. It even supports multiple time zones for globally distributed teams.
From Insight to Action: Dashboards and Automation
Finally, data that stays hidden in a report is data that doesn’t drive change. Timepiece operationalizes your KPIs by making them visible.
Jira Dashboard Gadgets: Any report you build in Timepiece can be saved and added directly to a Jira dashboard. Your team’s core KPIs like Cycle Time and Average Time in Review, can be visible at a glance, every day.
Scheduled Reports & Alarms: You can put your reporting on autopilot by scheduling key reports to be automatically emailed to stakeholders via a secure link. You can even set up “Alarms” to proactively notify you via email, Slack or MS Teams only if a KPI threshold is breached, allowing you to manage them with less effort.
Analytic Layer to Transform
Jira is an exceptional tool for managing tasks. But to truly improve your process, you must move from task-tracking to process-optimizing.
Doing so requires accurate, flexible, and visible KPIs. Timepiece provides the missing analytical layer, transforming Jira from a simple system of record into a powerful engine for continuous improvement. It gives you the data you need to find your true bottlenecks, balance your team’s workload, and build a faster, more predictable workflow.
By using Status and Transition count reports, you turn hidden frustration into visible, actionable data. To learn more about Timepiece – Time in Status for Jira, visit its Atlassian Marketplace page. You can see the documentation page by clicking here, and book a demo meeting by clicking here.